The Full Details of a Dexa Scan Report

The Full Details of a Dexa Scan Report

To read the original My Vital Metrics Blog, click here.

Understanding your Dexa Body Composition and Bone density results

One of the core tests that we do at My Vital Metrics is the DEXA Scan – sometimes called just DXA. We’ve written a lot about this one test of course, because it is at the very centre of our services, because body composition is possibly the single most revealing set of statistics around a person’s health and their performance, if they are an athlete. 
 
In this blog post we are going to step through a full DEXA report, with all the things that we are able to extract from it, page by page. Hopefully it will give you a good sense of what a DEXA consultation looks like, and what kind of information you will get if you come to visit us in our lab in central London. 
 
Firstly, as we’ve discussed before: DEXA is what we call a 3-compartment model. This means that it separates the body into 3-compartments: Bone, Fat, and everything else, which is considered lean mass. In this it separates itself from many of the other methods which will measure only fat, or only body water, and assume standard values for the other compartments. 
 
With that in Mind, lets turn to the first page of the report, because this is the main page that’s all about bone density. 

Understanding Bone density Results

As you can see from the page, for each part of the body (left arm, left leg, left ribs, T-spine etc) you get an overall size of the bone, and an overall weight. This weight in grams is the dry weight of the bone – in other words, the weight of the dry calcium in your bones. Then there is a calculation of bone density with divides one by the other. You get a bone density for each part of the body, and then a total.

 
In specific circumstances there might be good reason to go into each area. Sometimes for runners we see very dense lower limbs and pelvis, but weak upper body parts because they get no attention.
 
At the end of the report you are presented with a figure called a z-score, and sometimes a second figure called a t-score. These two figures are the most important statistics when it comes to bone density. Your report will only calculate a t-score if you are over 40.
 
The Z-score compares your overall bone density to other people your age. The figure will be expressed in standard deviations from the average for your comparable population: e.g. White Females. A Z-Score of 1.2 means that you have a bone density that is 1.2 standard deviations higher than the average for your age/sex/ethnicity. This means that your bones would be more dense than about 89% of the population.
 
 
CleanShot 2022 07 16 at

The T-Score doesn’t compare you to your own age group, but rather compares your bone density to what is considered ‘peak’ bone density – which is usually a healthy 30 year old, or thereabouts. Once again it is expressed in standard deviations, so a positive value means you have more dense bones than average, and a negative value means your bones are less dense than average.

CleanShot 2022 07 14 at
This is critical, because all bone conditions are defined in terms of a T-score. A T-score of -1.5 is called osteopenia – thinning of the bones, and a T-Score of -2.5 or less is called osteoporosis. It should be noted that because we are doing full body scans, and we are not supervised by medical professionals, we are unable to diagnose such conditions directly. To get a formal diagnosis you would need to have a DEXA scan done of just your lumbar spine or your femur, under the supervision of a radiologist, and they would be able to offer a diagnosis and may suggest treatment. 
 
The second page, which will only come up upon your second Dexa scan and beyond, will show progress of bone density. These figures will go up and down, so it is overall trends we are looking for, and don’t expect any double-digit changes here – 1-2% either way is about the most I’d usually expect between scans. 

Understanding Body Composition Results

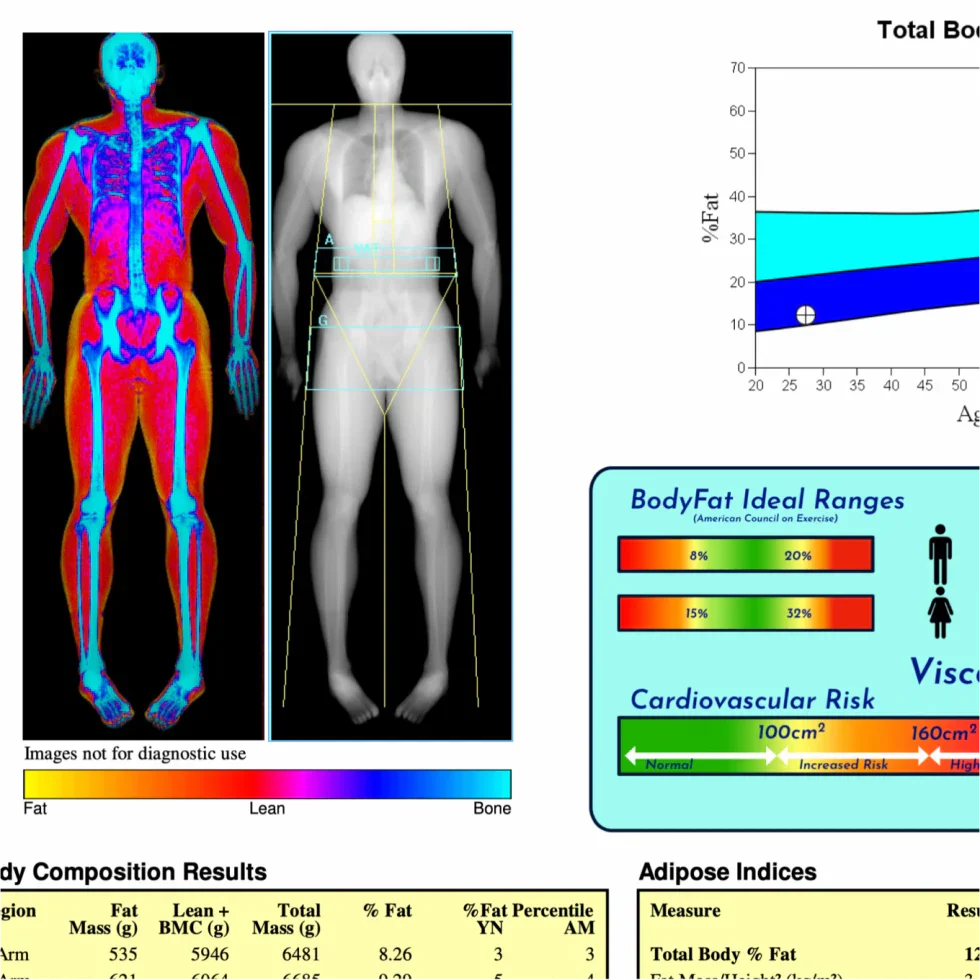
the next page of the report is where we start to get into the body composition, and the first figure we’ll pull out here is the overall body fat %. There are ideal reference ranges body body fat, laid down by the American Council on Exercise (ACE), which is 8-20% for men and 15-32% for women. It is interesting to note that these ideal ranges are actually age independent.
Next we break down the fat, and look at how it is distributed about the body (2). In particular we look at the fat that a person stores around their midsection – this is called ‘android fat’ as it is where men will typically put on more fat. We compare this to the fat that sits around the bum, hips and thighs. This is called ‘gynoid fat’ as it is where women typically put more fat on. Together, when we compare these figures, we get the Android/Gynoid Ratio (3). A figure above 1 means the person puts more fat on around the middle, and a figure less than 1 means they put more on around the hips and thighs.
 
The android to gynoid ratio for a person doesn’t usually change a lot. It is a pattern that is largely determined by genetics and hormonal makeup. Exceptions to this might happen if, for example someone were to start hormone therapy, or go through the menopause. Over time, the changed hormonal environment in these circumstances may lead to a change in the distribution of fat.
 
What this pattern of fat deposition tells us is how efforts towards fat loss might look. If you are someone who is predisposed to much more fat around the thighs, then it is likely that in a fat loss journey, this area will seem like it is the last to shift.
 
Somewhat connected to the pattern of fat distribution, but a really critical statistic of its own is the quantity of visceral fat (4). Visceral fat is the fat that sits inside the abdominal cavity and around the organs. You can’t necessarily touch it – if you can grab fat around the belly then it ISN’T visceral fat. DEXA is the only technology which can measure this important metric.
CleanShot 2022 07 16 at
Visceral fat is considered especially dangerous. Even small amounts extra is highly correlated with heart disease and a host of other metabolic and cardiovascular risk factors. It is measured 3 ways, in weight, in volume and in surface area. Oddly most of the studies have been based on surface area, and this is the figure we concentrate on. Anything below 100cm2 is considered normal. from 100cm2 to 160cm2 is considered increased risk of cardiovascular disease, and above 160cm2 is considered high risk.
 
If you come up high, we will go into some depth about lifestyle, as factors like sleep quality, stress, and alcohol are all factors which may disproportionately lead to increased visceral fat. Because of this, you may be lean, but still have a high visceral fat – and if that’s the case, it’s considered even worse.
 
Finally, on the body composition main page, we will look at the overall lean index. The Lean index is a little bit like the BMI (Body Mass Index) but it only counts ‘lean mass’ which effectively means it is only counting the muscle. Like BMI it is divided by height squared, so this figure measures how much muscle you have for your height. This means that it might be harder for tall people to bring this metric up. Generally more is better, and I usually like to see a figure above 16.8 for women, and 19.8 for men – but the context is key. For some lightly built people this may not be achievable, and we will see how this changes over time instead.
CleanShot 2022 07 16 at
Onto the final page of the main report we see all the figures we have seen on previous pages, just laid out in one big table. 
 
We don’t go over old ground on this page, but instead will just focus on muscular balance. We look at the amount of muscle in the left arm, vs right arm, and in the left leg vs right leg. If they are more than 10% different left to right, we will point this out and discuss remedial actions. 
 
Lastly, when you come in for repeat scans, you get the following page, which shows you exactly how things have changed overall, and each time you’ve come in. Here we can see a young bodybuilder who has been going through a very obvious bulking and cutting cycle – so we are able to track how much lean mass he is putting on in the bulk, and how much fat mass, and how much lean and fat mass he is losing in his cut. As you can see, in this example, he’s done a really good job in each cycle of preserving some of his lean mass through the cut, and limiting the fat gain through the bulk. 
 
After the raw DEXA report, we then turn to the action blueprint which really brings it all together, and turns the figures into an action plan to guide your future efforts. That may be the topic of another post however. 
 
As ever, with all the above, your personal situation is all-important and context is key. We always try to stick to the best science, and will try not to get drawn on elements for which we feel this isn’t good scientific basis. 
 
If you’ve any questions about any of the above, please do get in touch. 
Back to blog